반응형
Gurobi 설치
[Gurobi] 최적화 프로그램 구로비 무료 학생판(academic license) 다운로드
준비물 학교 네트워크에 연결된 컴퓨터 Gurobi 회원가입 https://portal.gurobi.com/iam/register/ User Portal portal.gurobi.com 졸업연도, 월을 써준 후 next 비번 입력 후 submit 학교 메일로 온 숫자 입력 그러면 회원
kimhongsi.tistory.com
준비물
구로비가 설치된 파이썬 환경
*설치방법* : pip install gurobipy 입력
pip install gurobipypip install colour
[Gurobi] 구로비로 P-median 문제 (PMP) 풀기 with Python :: gurobipy
P-median 알고리즘 P-Median 문제는 공장, 창고, 물류센터 또는 공공시설 등을 설치할 수 있는 후보입지가 주어져 있다고 가정하고 각 후보입지는 소비자 수요 발생지역을 나타내며 각 시설로부터 각
kimhongsi.tistory.com
p-center이 아닌 p-median이 필요한 경우 이곳을 참조
P-center

P-center 구로비 코드
https://www.youtube.com/watch?v=AYe5xQOm5hU
기본 환경 설정
from gurobipy import *
import numpy as np
import matplotlib.pyplot as plt
#노드 개수:
N=21

#x.y 좌표:
np.random.seed(1)
X = list (np.random.random(N)*100)
Y = list(np.random.random(N)*100)

#수요량
demanda = list (np.random.randint (low=10,high=50,size=N))
#시각화:
plt.figure(figsize=(12,5))
plt.scatter(X,Y,color='blue')

for i in range(len(X)):
    plt.annotate('$d_{%d}=%d$'%(i, demanda[i]),(X[i]-0.5,Y[i]-5))

plt.xlabel("X axis")
plt.ylabel("Y axis")
plt.title("nodes")
plt.show()


# 세트:
nodos = [i for i in range(N)]
ubicaciones = [i for i in nodos]
arcos = [(i,j) for i in nodos for j in ubicaciones]

#최대 위치 수:
P=5

#거리 행렬:
distancia = {(i,j): np.hypot (X[i]-X[j],Y[i]-Y[j]) for i in nodos for j in ubicaciones}
# relative weighs:
demanda_total = sum(demanda)

w = {i:demanda[i]/demanda_total for i in nodos}
w

model = Model('P-Center')

# 결정 변수
x = model.addVars(arcos, vtype = GRB.BINARY, name = 'x')
y = model.addVars(ubicaciones, vtype = GRB.BINARY, name = 'y')
z = model.addVar(vtype = GRB.CONTINUOUS, name = 'z')

# 목적함수
model.setObjective(z, GRB.MINIMIZE)

# 제약조건
model.addConstrs (quicksum(distancia[i,j]*x[i,j]*w[i] for i in nodos) <=z for j in ubicaciones)
model.addConstrs (quicksum(x[i,j] for j in ubicaciones) == 1 for i in nodos)
model.addConstr(quicksum(y[j] for j in ubicaciones) <= P)


# M formulation:
M = len(ubicaciones)
model.addConstrs(quicksum(x[i, j] for i in nodos) - M*y[j] <=0 for j in ubicaciones)

model.optimize()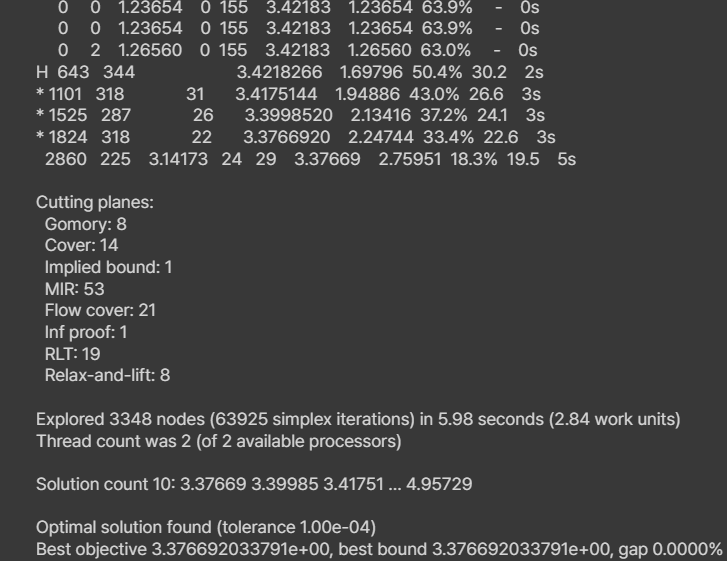
#arcos activos:
arcos_activos = [k for k in arcos if x[k].x > 0.9]
print(arcos_activos)
#ubicaciones Activos:
ubicaciones_activos = [k for k in ubicaciones if y[k].x > 0.9]
print(ubicaciones_activos)

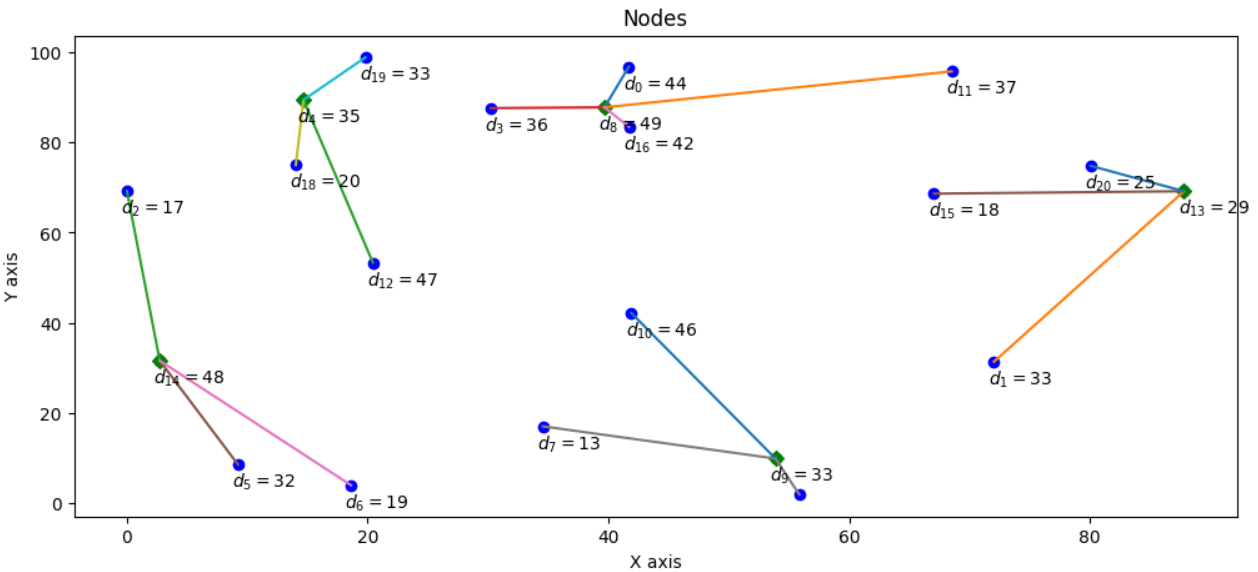
#Gráficar la solución
from colour import Color
plt.figure(figsize=(12,5))
plt.scatter(X,Y,color='blue')

for n in ubicaciones_activos:
    plt.scatter (X[n],Y[n],color='green',marker='D')

for i in range (len(X)):
    plt.annotate('$d_{%d}=%d$'  % (i,demanda[i]),(X[i]-0.5,Y[i]-5))

for n in arcos_activos:
    i=n[0]
    j=n[1]
    plt.plot([X[i],X[j]],[Y[i],Y[j]])
plt.xlabel ("X axis")
plt.ylabel("Y axis")
plt.title("Nodes")
plt.show()
반응형
'🖥️ IT, 컴퓨터 > 🚀 최적화' 카테고리의 다른 글
| [최적화] p-center 문제 정리, 파이썬 코드 (0) | 2023.08.22 |
|---|---|
| [최적화] P-median 문제(PMP) 정리, 파이썬 코드 (2) | 2023.08.22 |
| [최적화] CBC (COIN-OR branch and cut) solver (0) | 2023.08.16 |
| [Python] P-Center Problem을 Pysal로 구현하기 (0) | 2023.08.16 |
| [최적화] Google OR-tools (0) | 2023.08.09 |

댓글